The Quiet Enjoyment Project

Understanding Noise Pollution in Boulder

Where it is, where it comes from, and who bears it

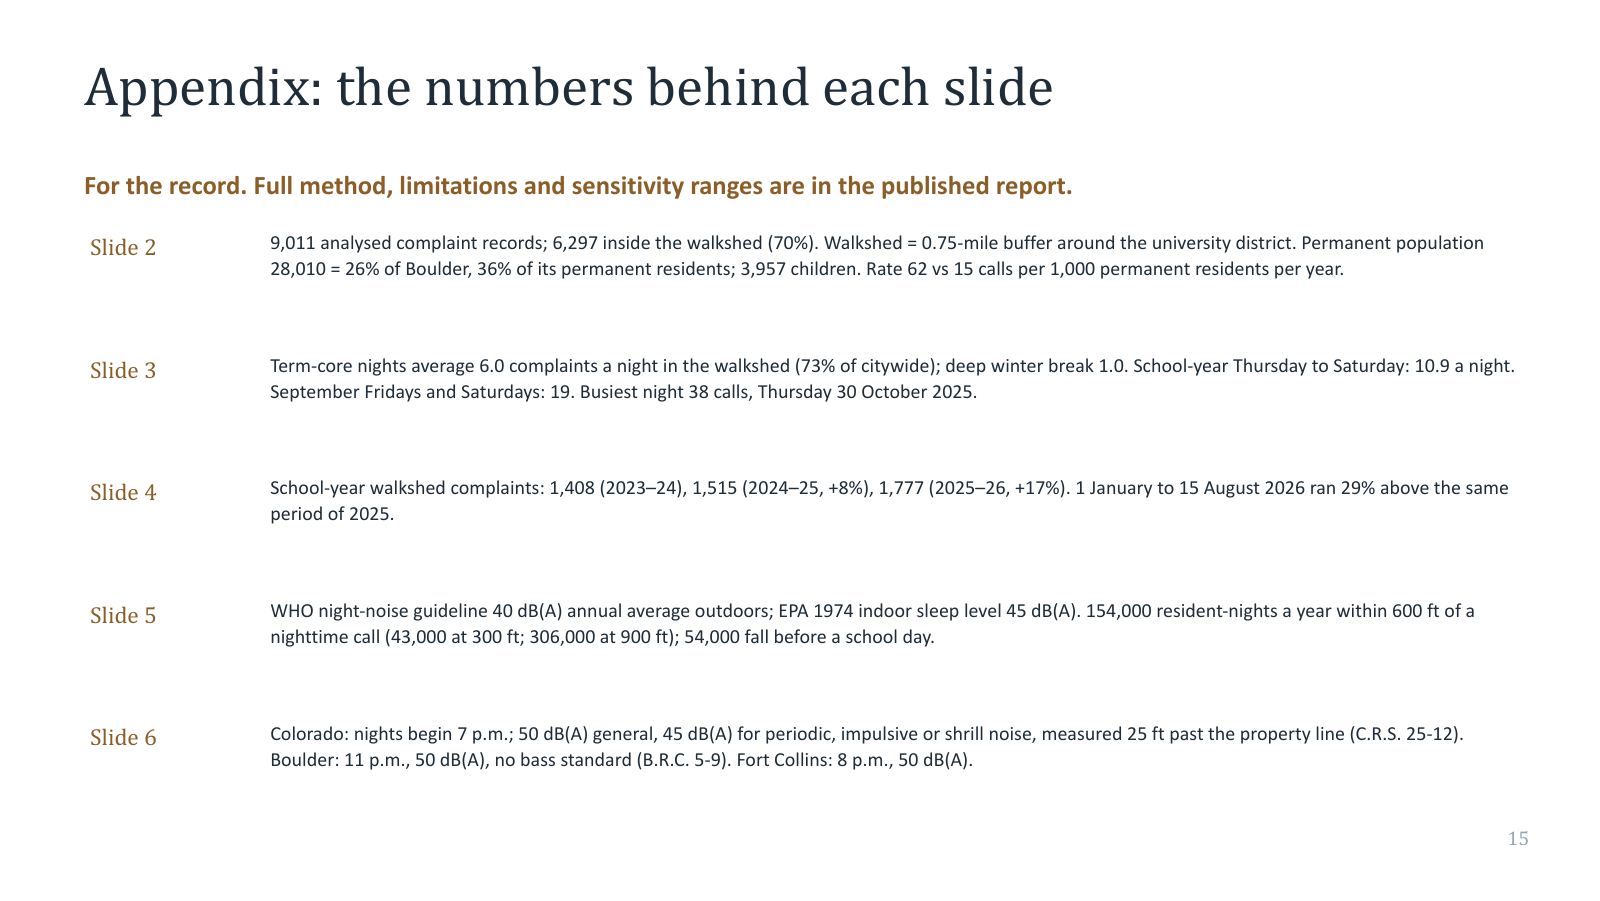
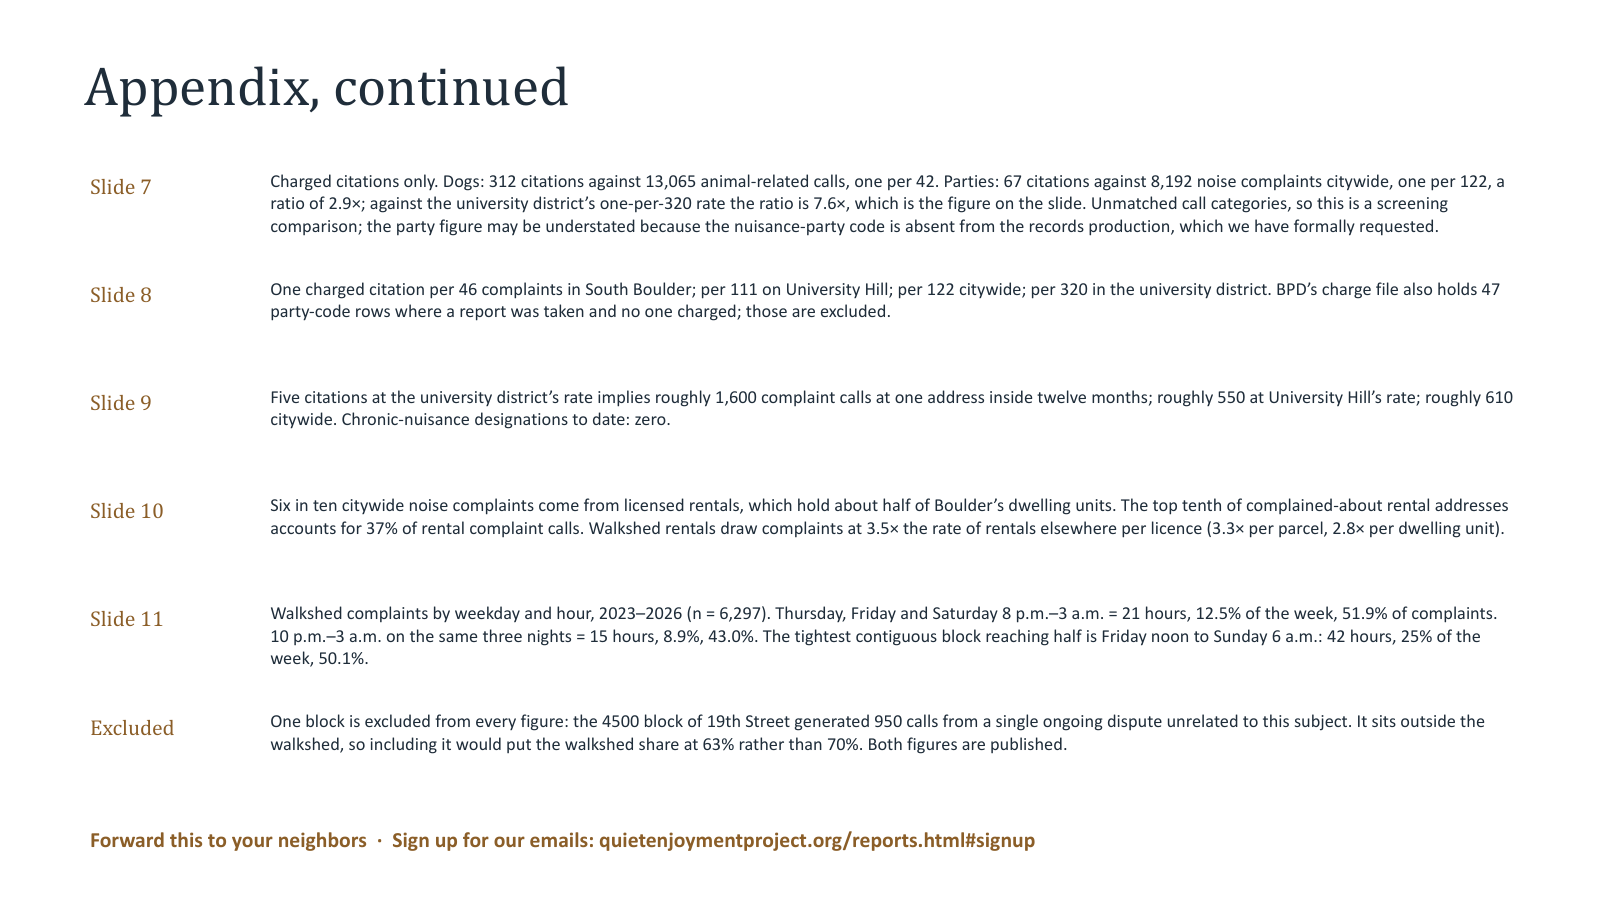
Every figure below comes from a public record: police calls for service, the City’s rental-licence rolls, the county assessor and the 2020 census. Every dataset and script is published alongside it, and the numbers behind each slide are on the last two pages.

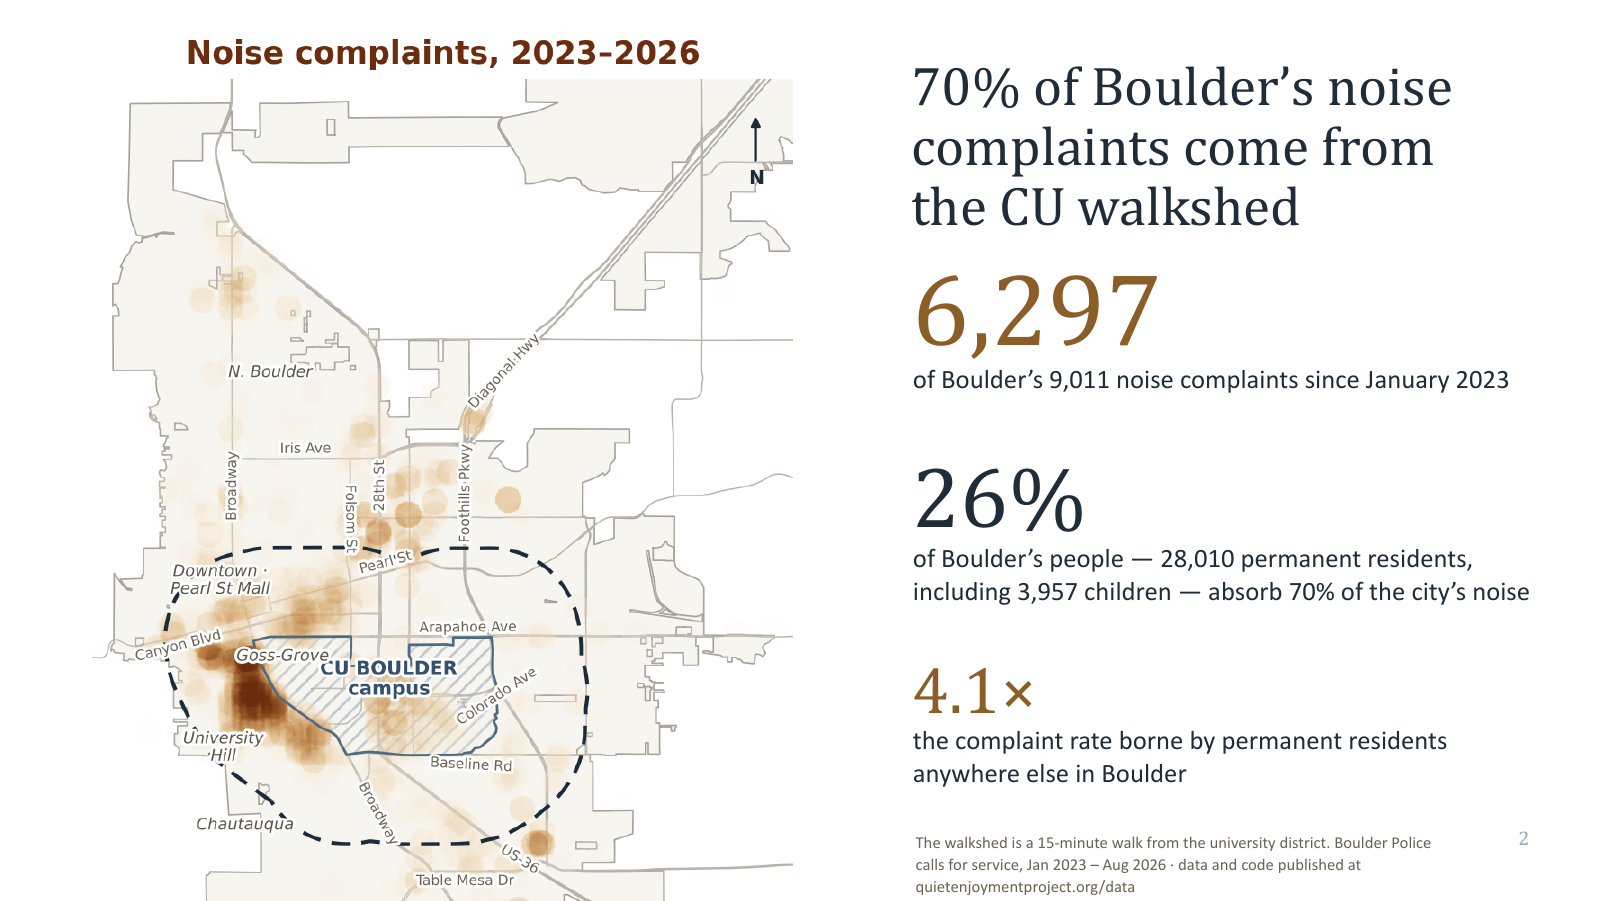
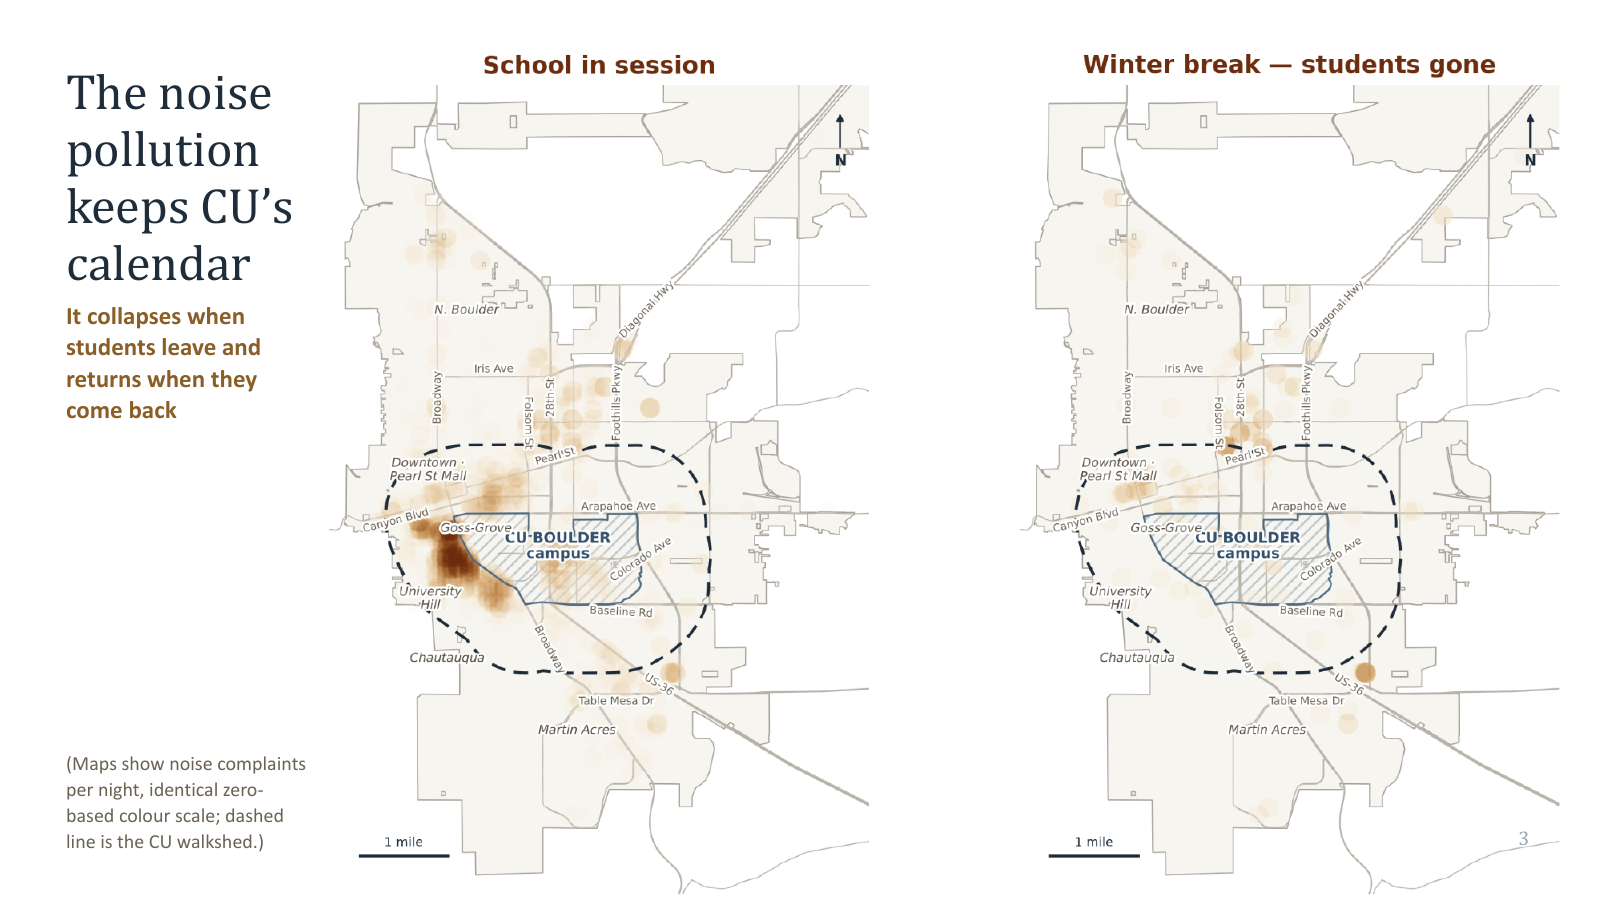
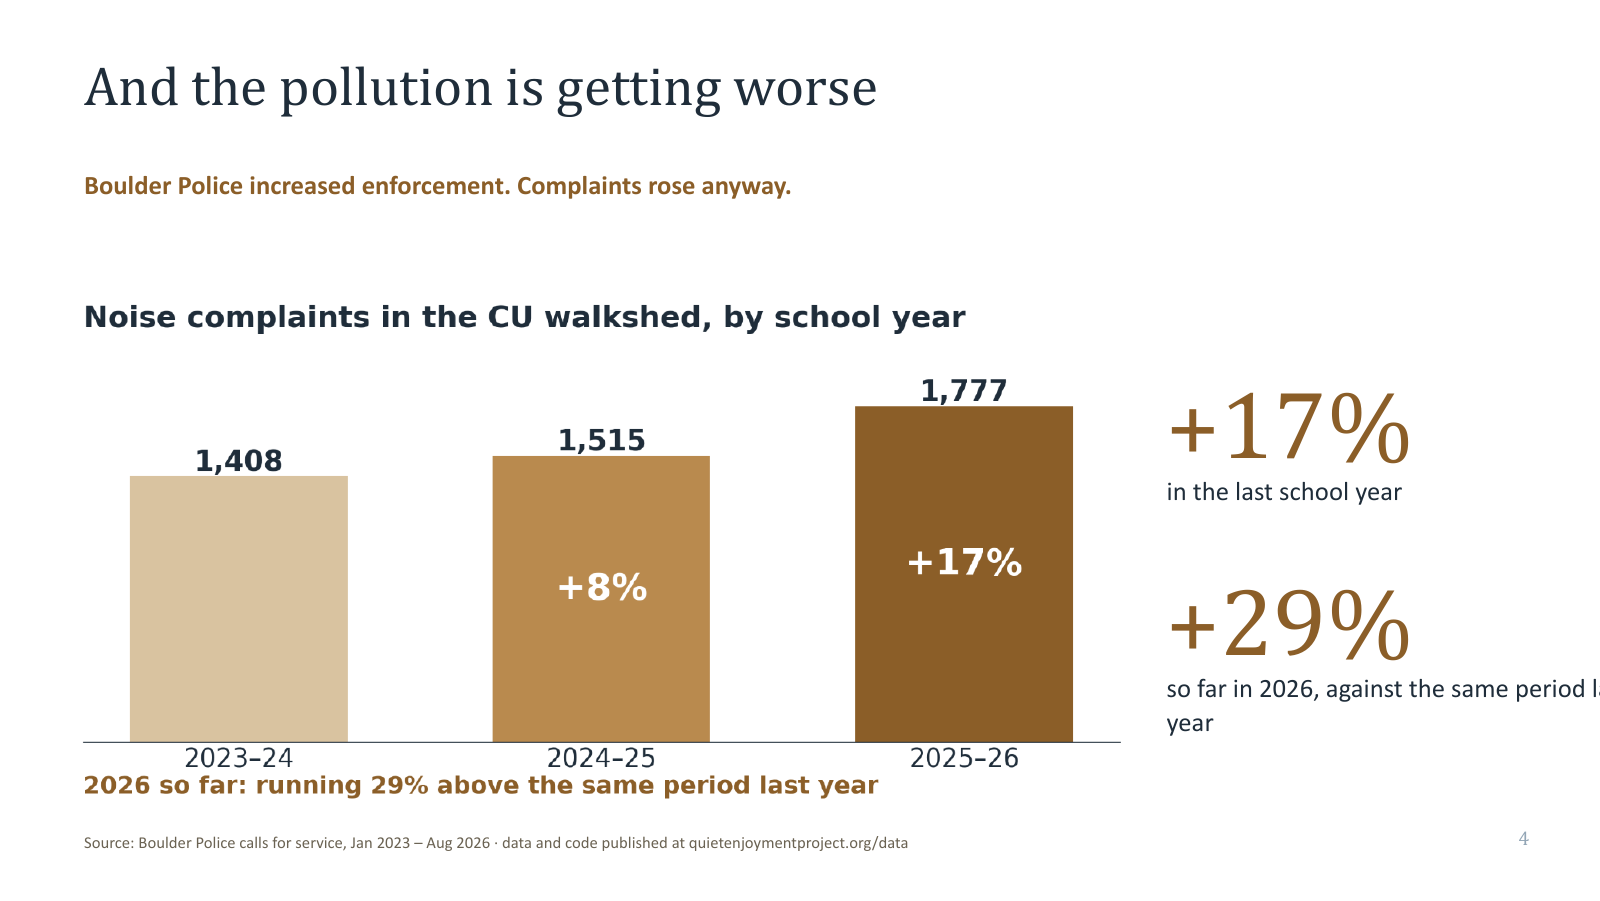
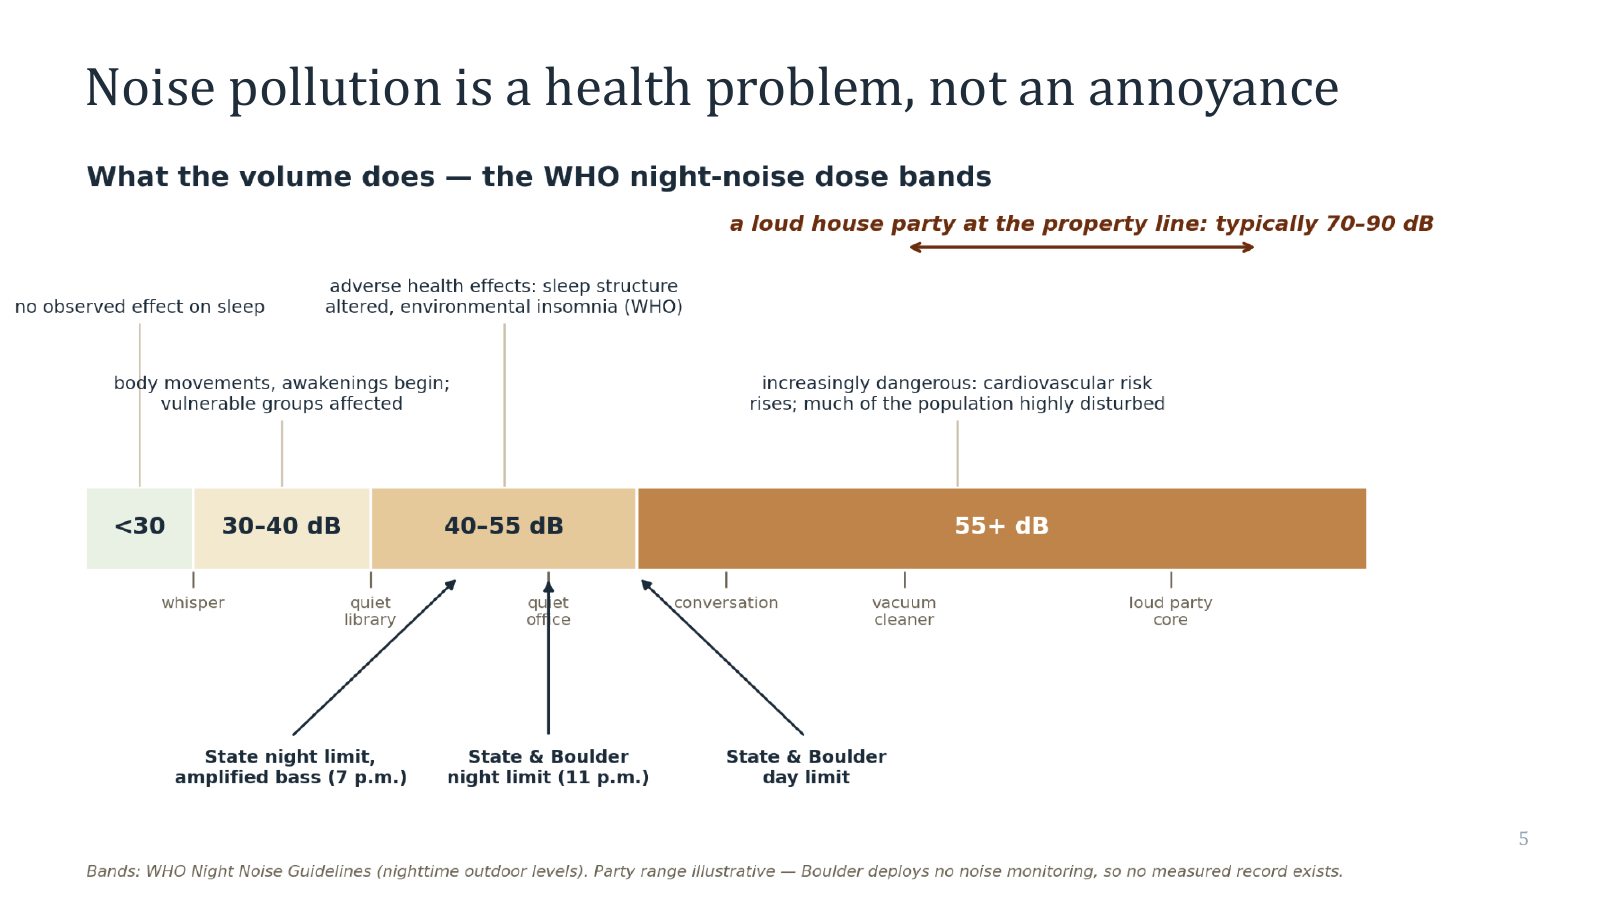
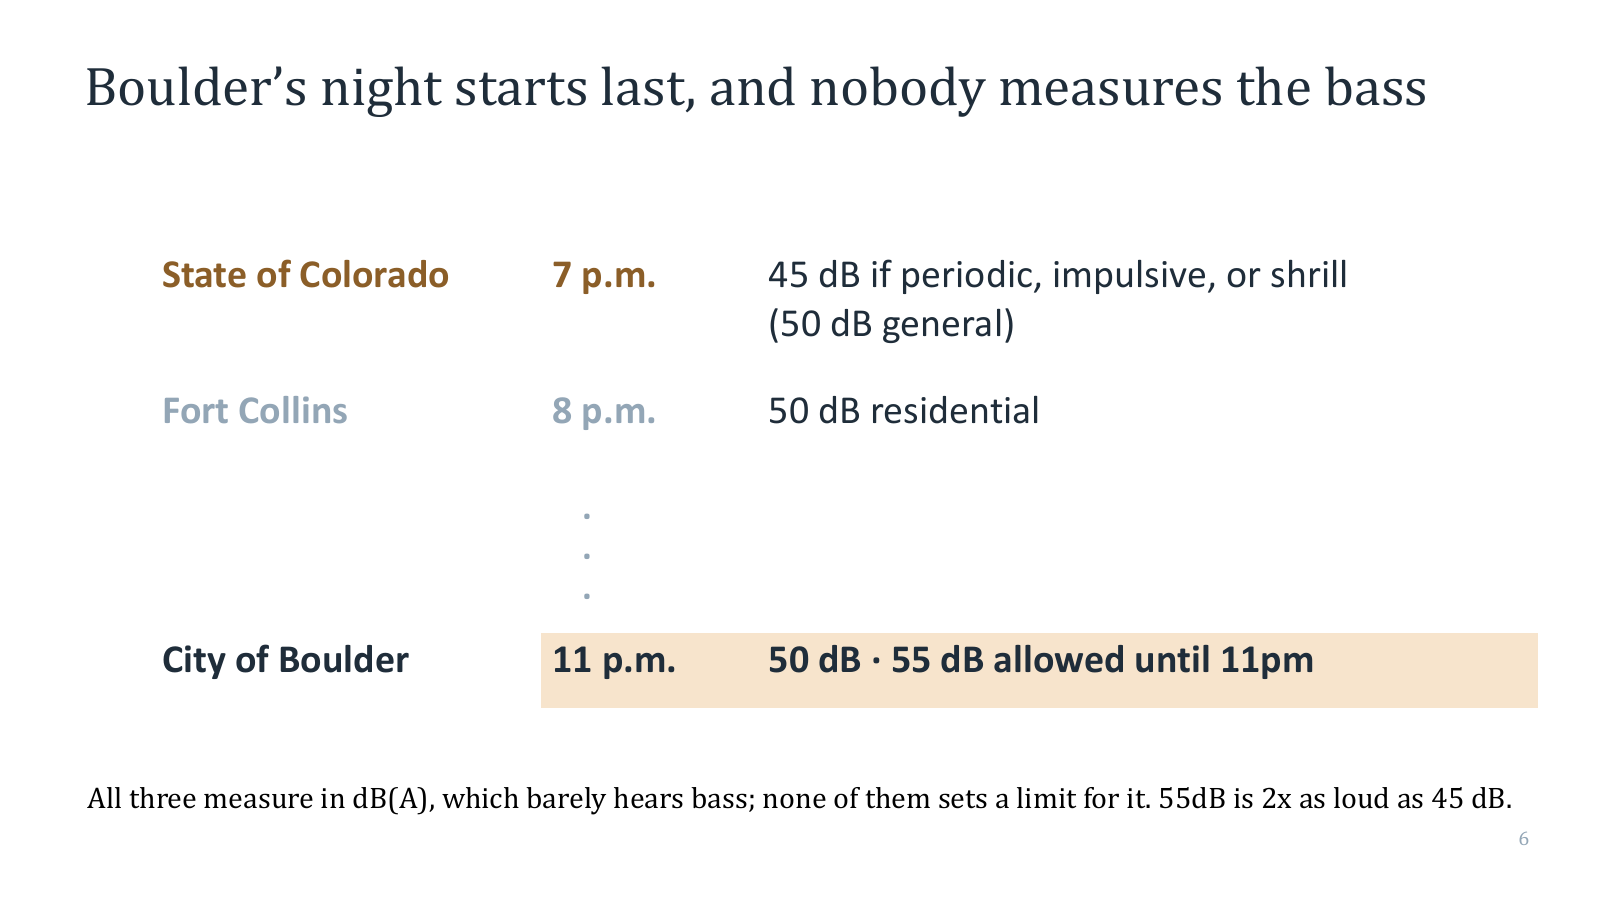
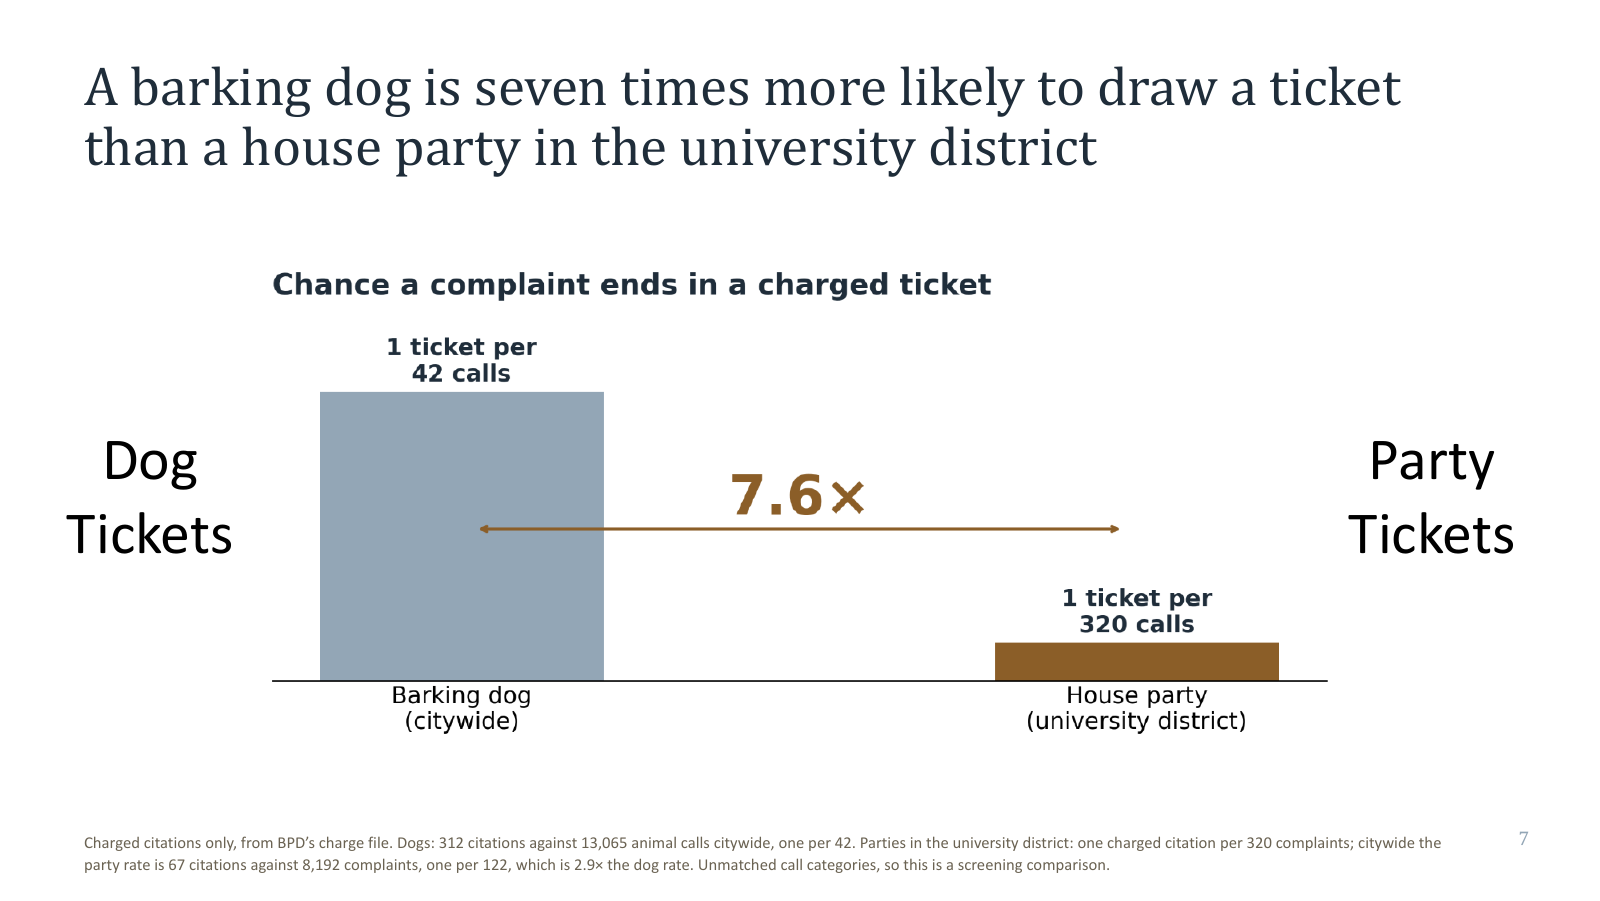
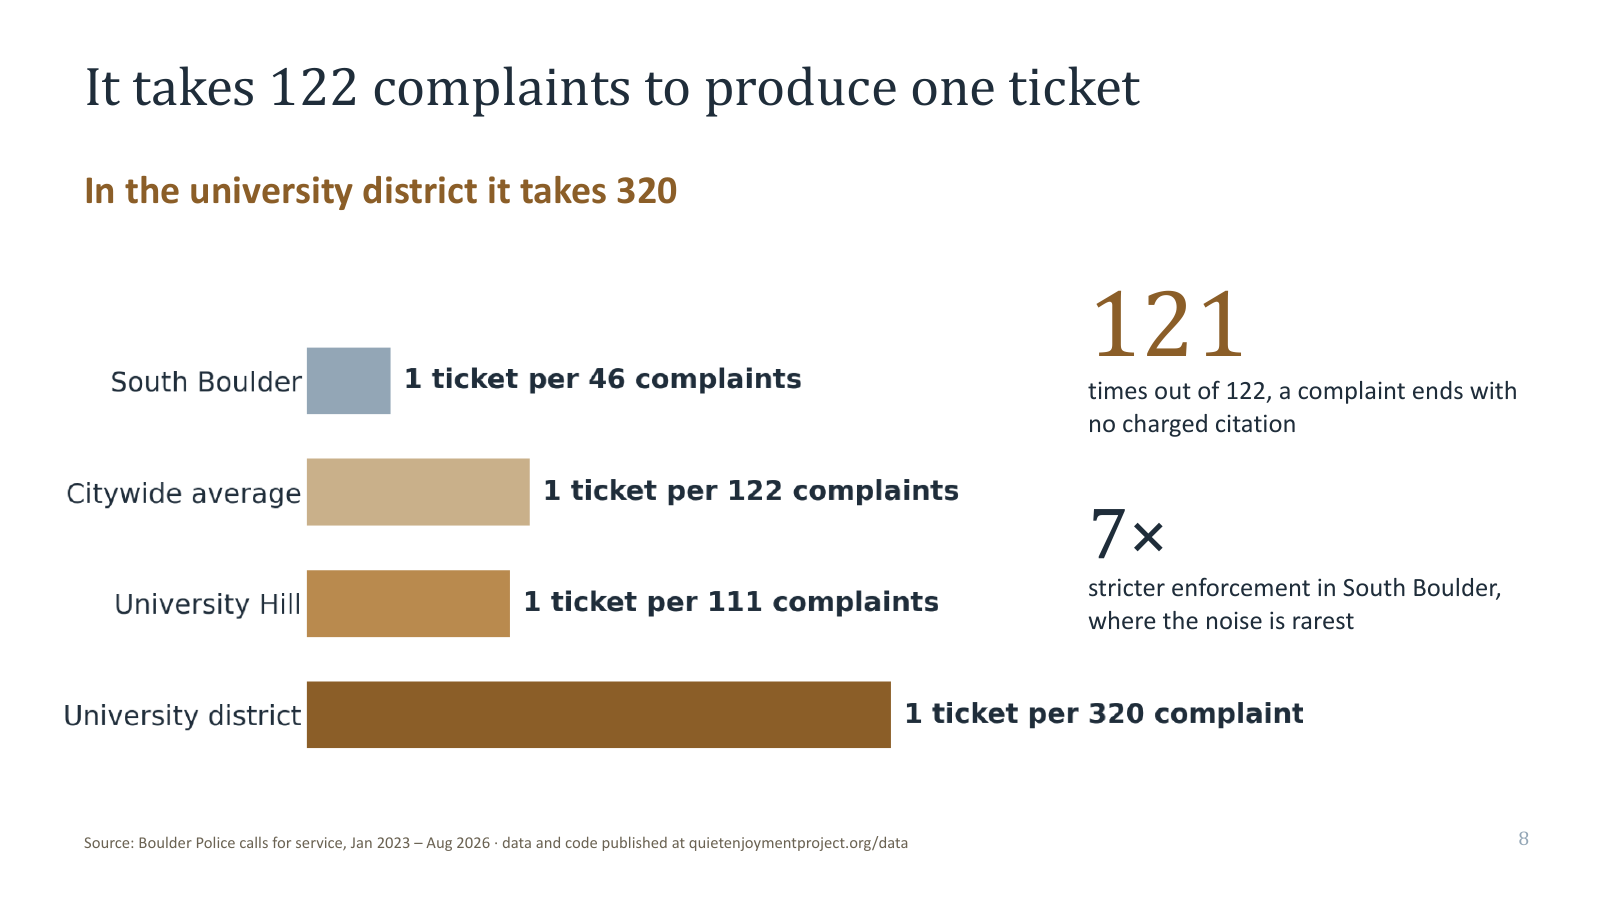
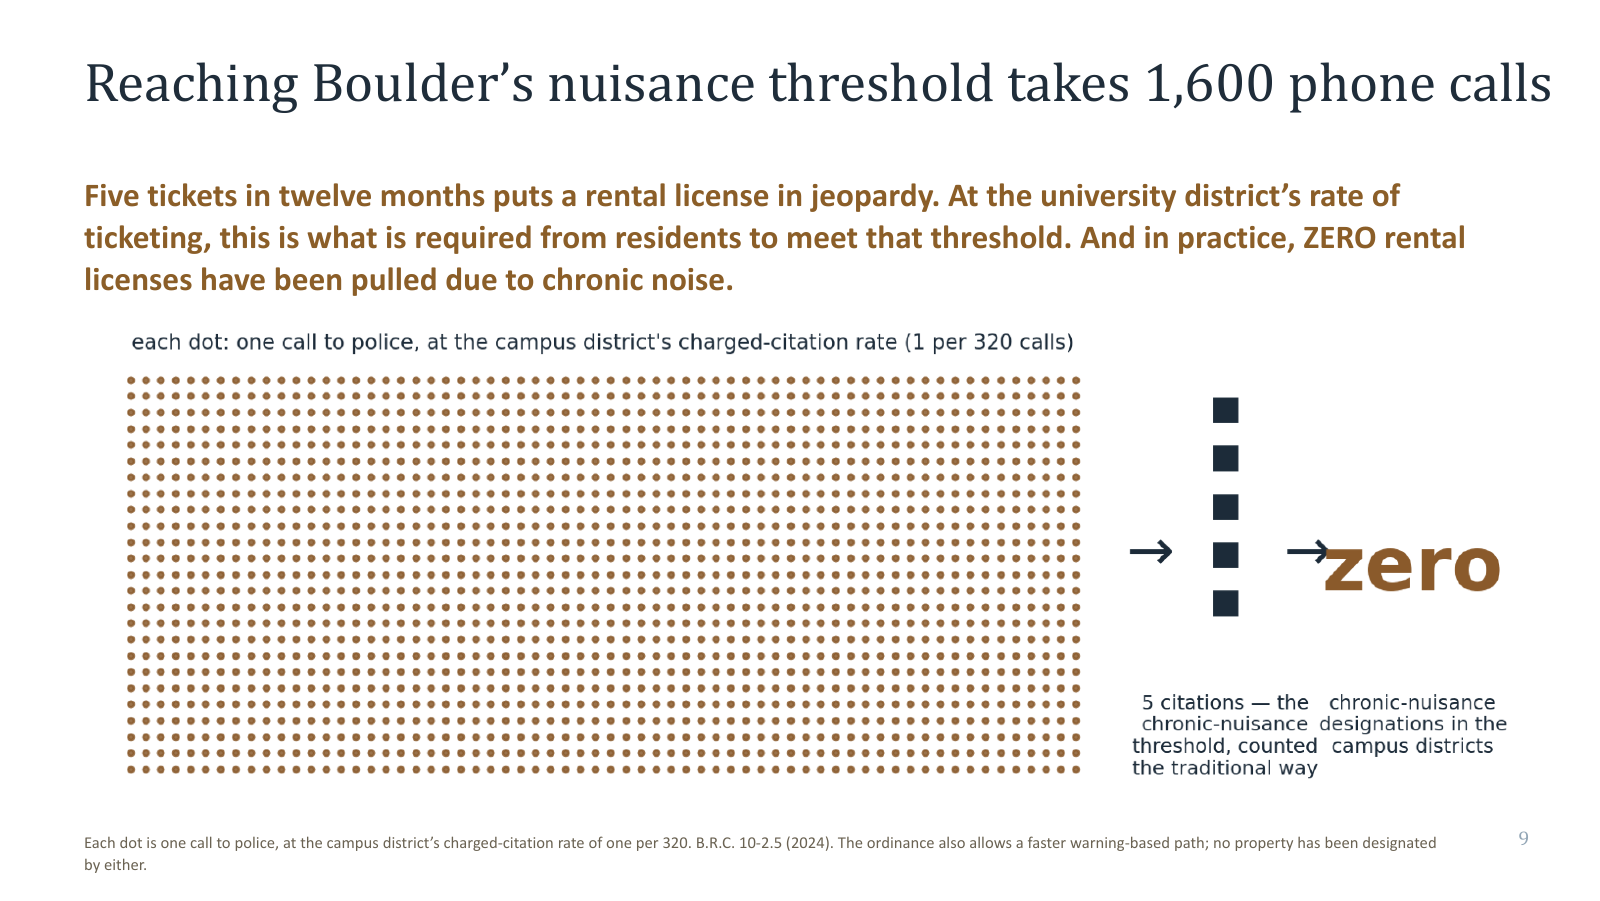
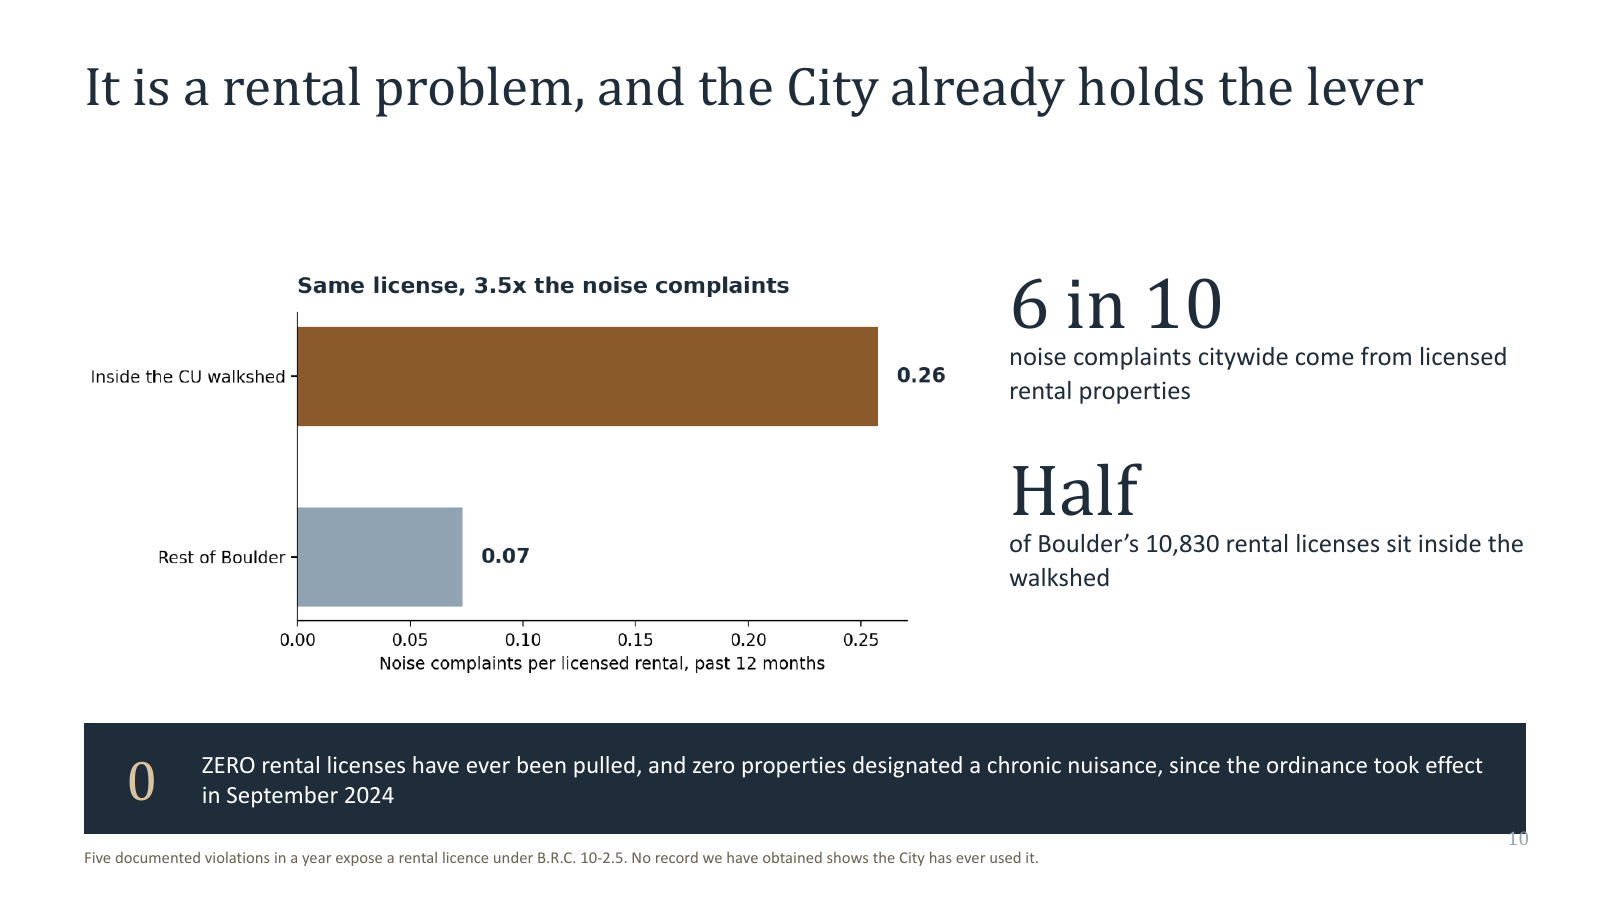
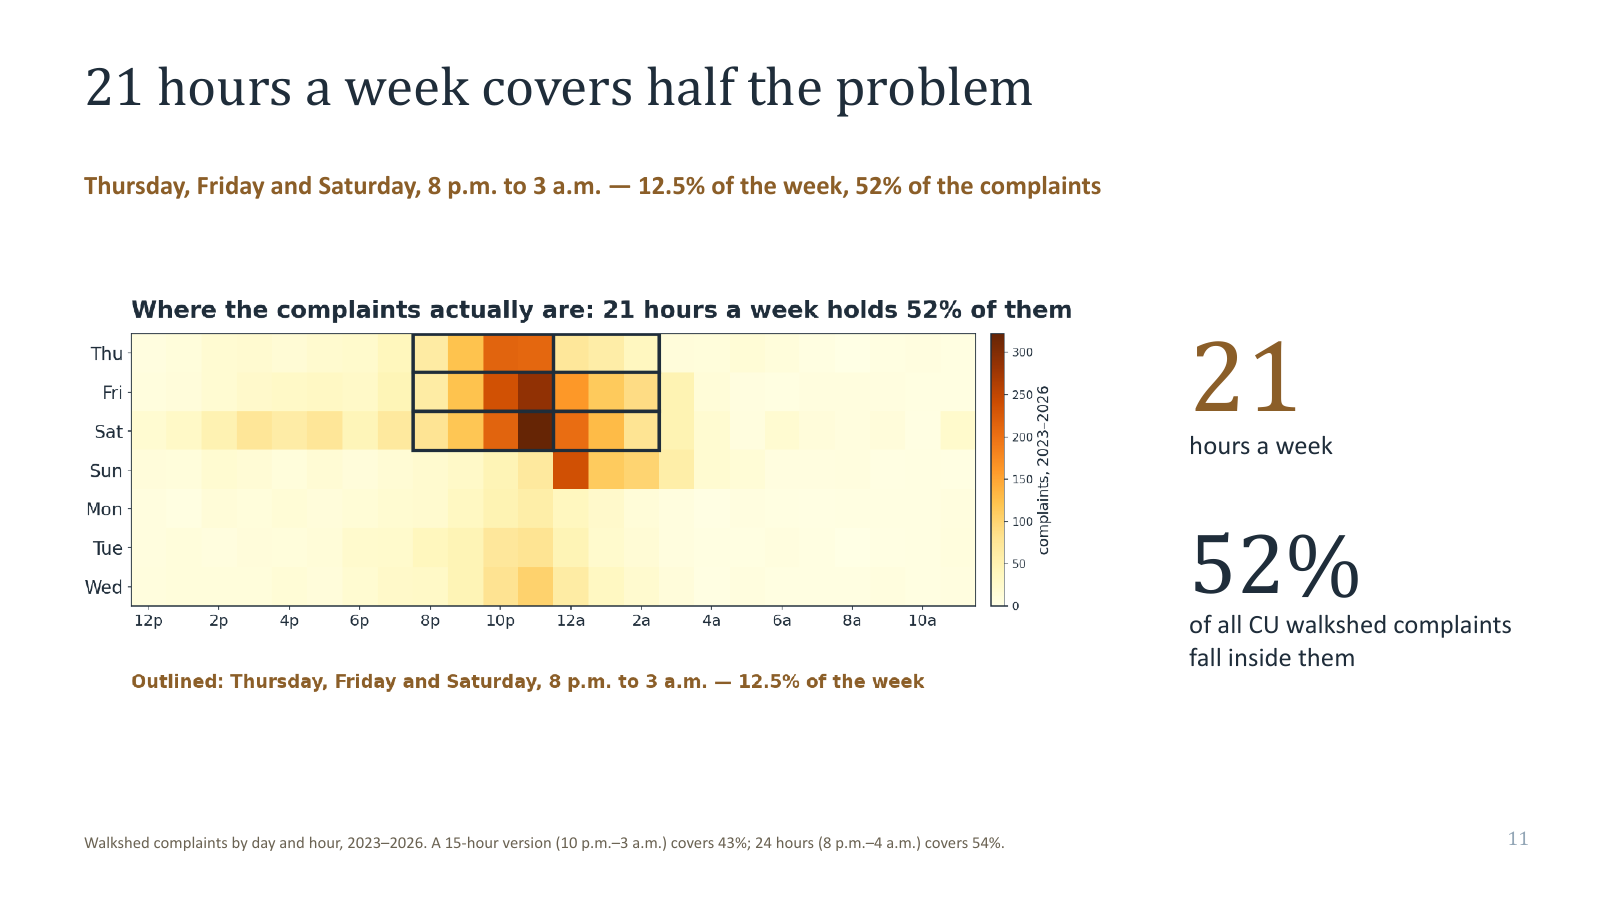
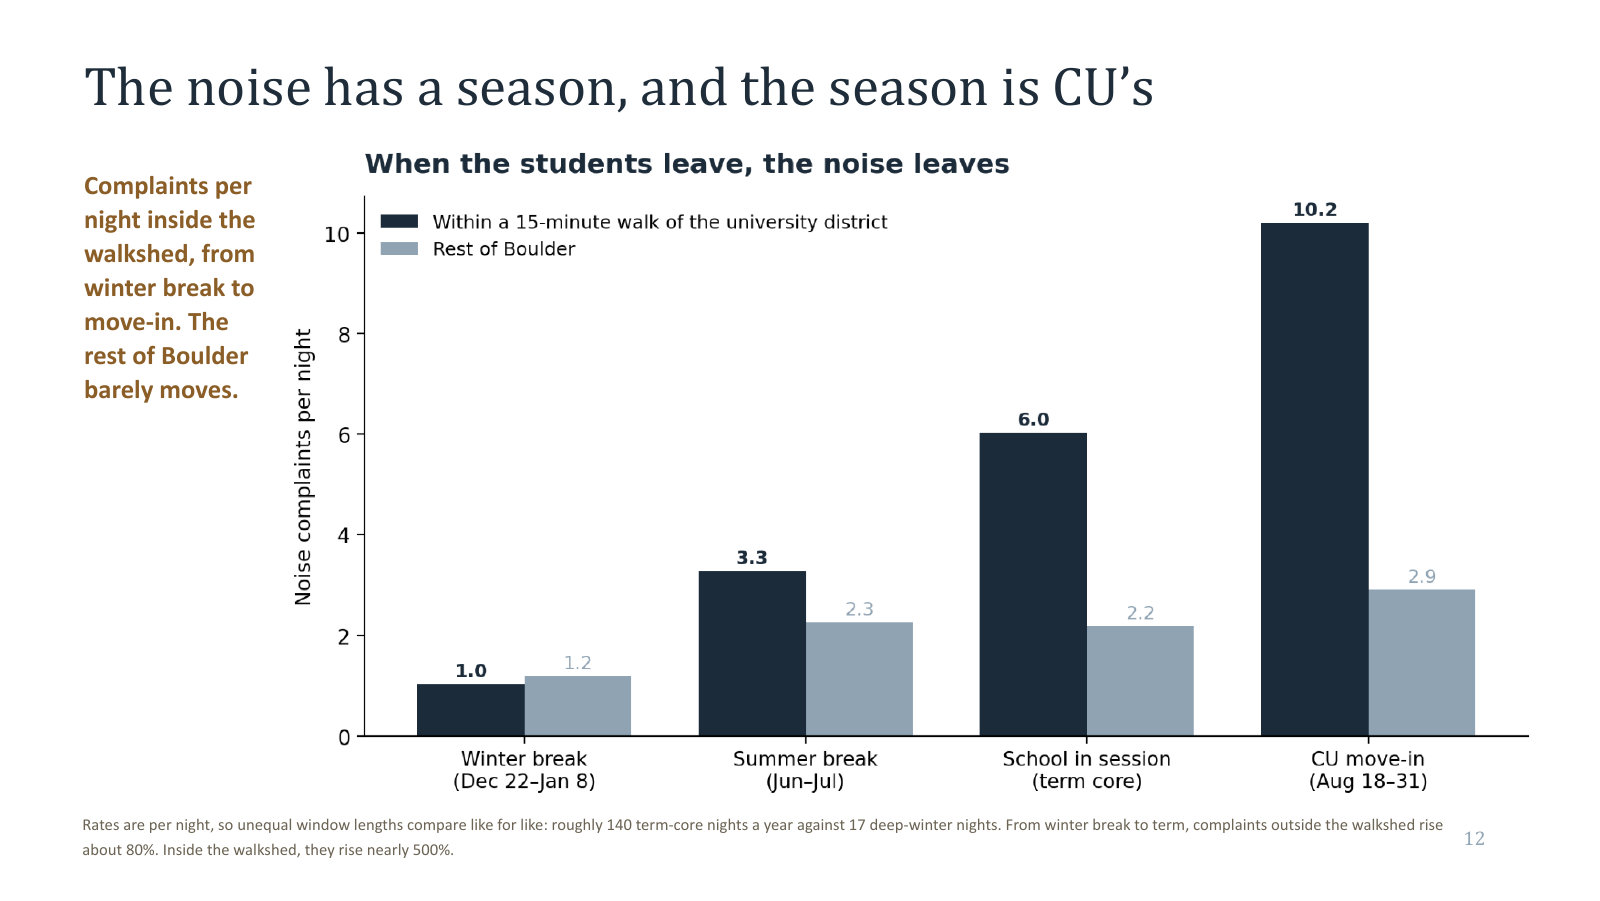
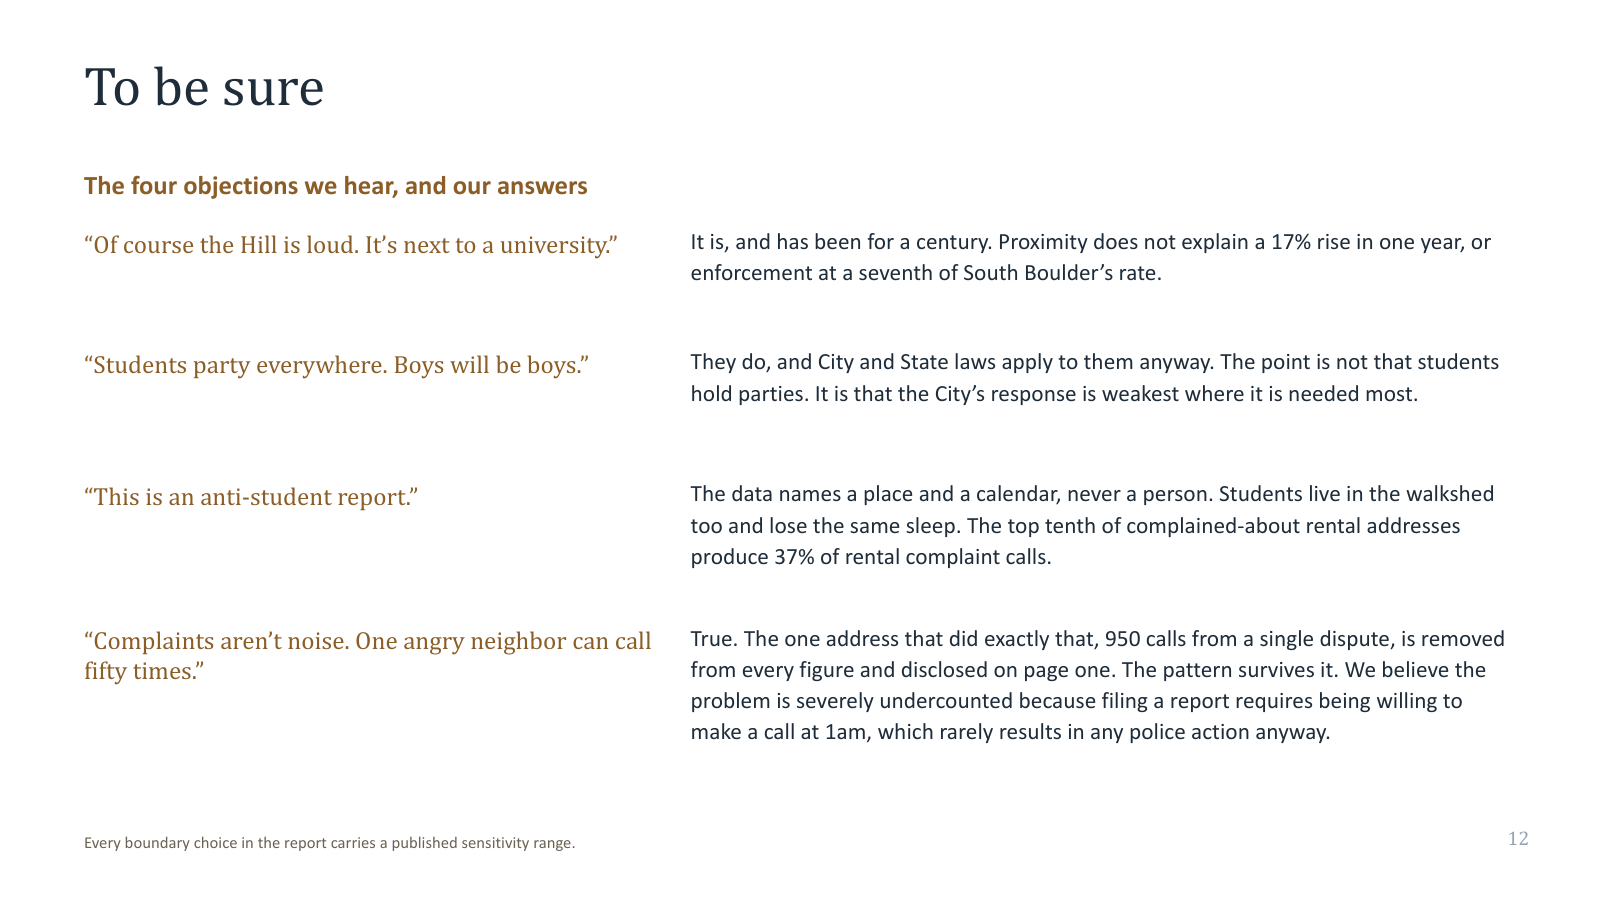
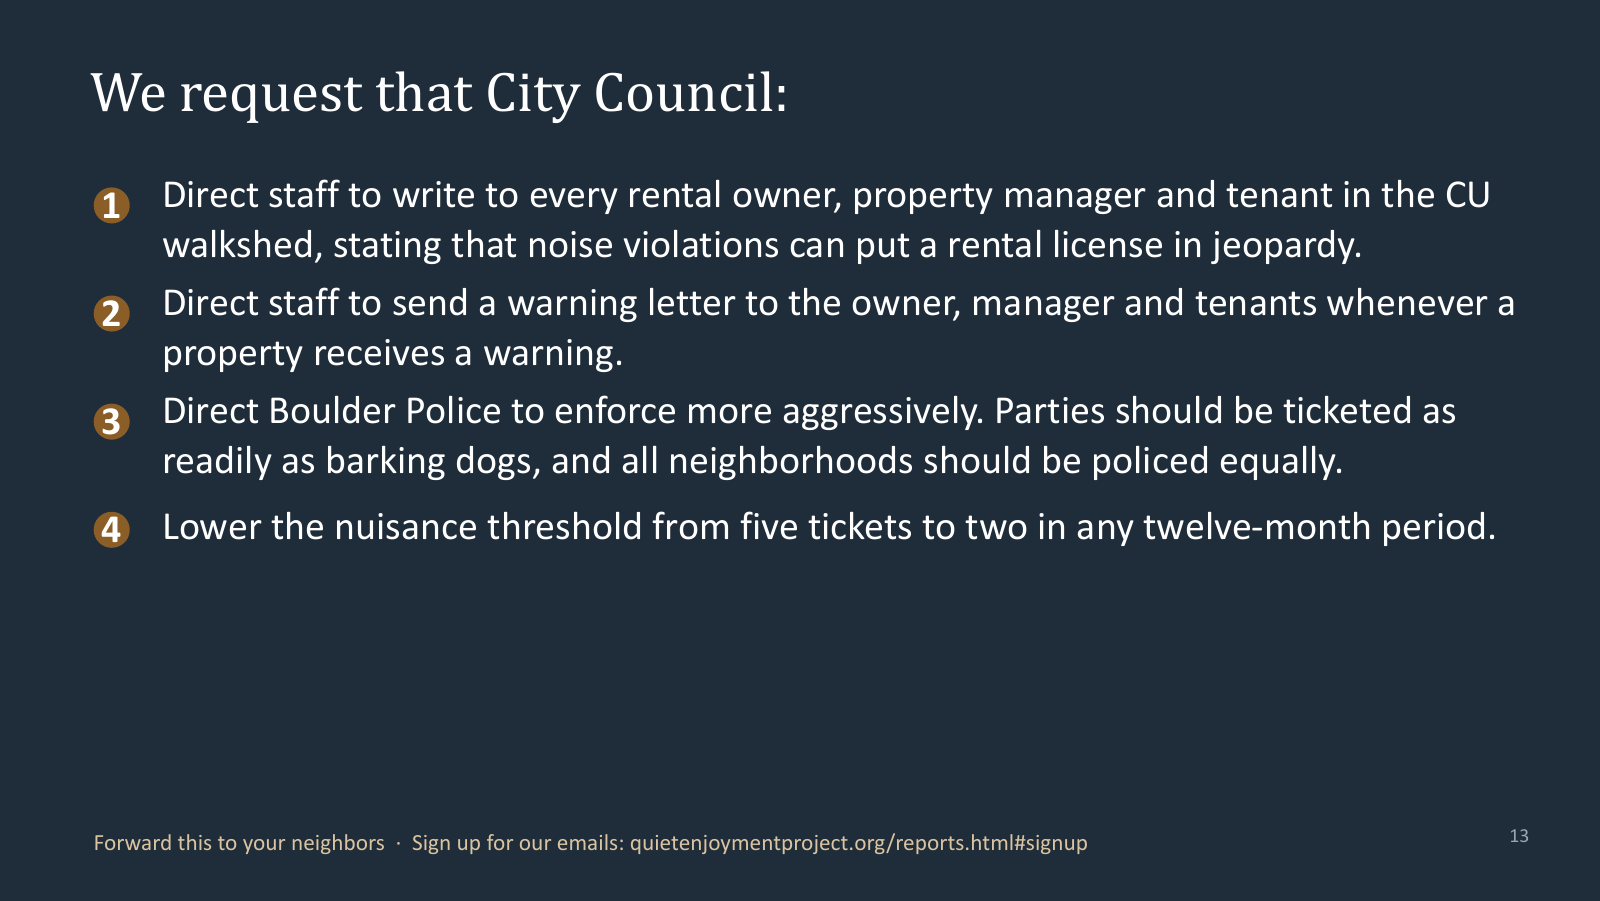
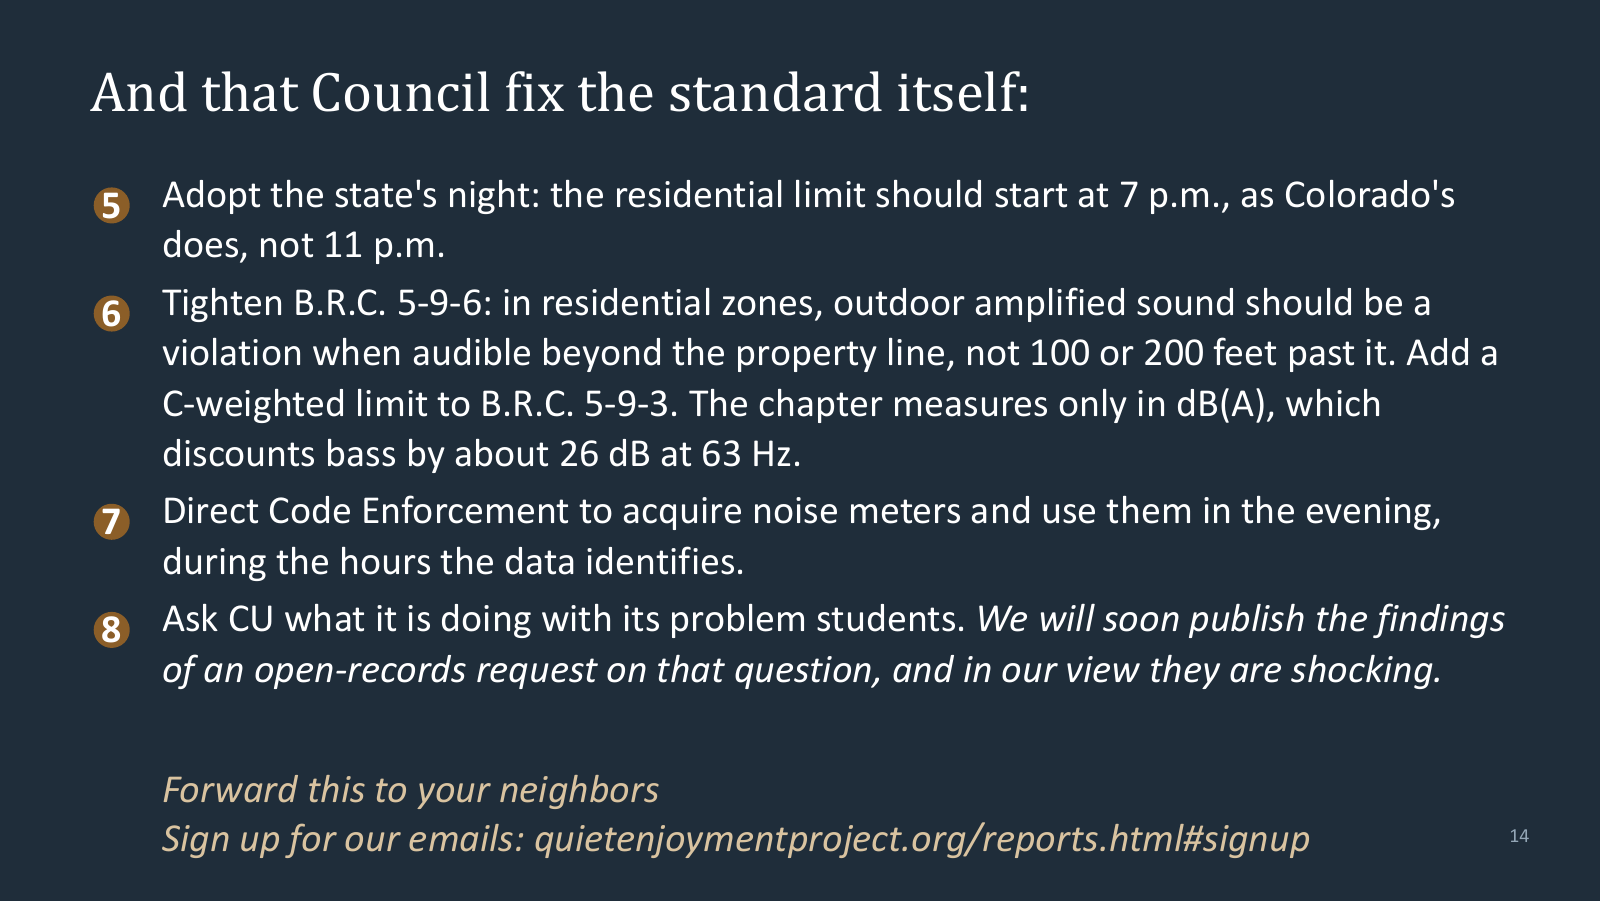
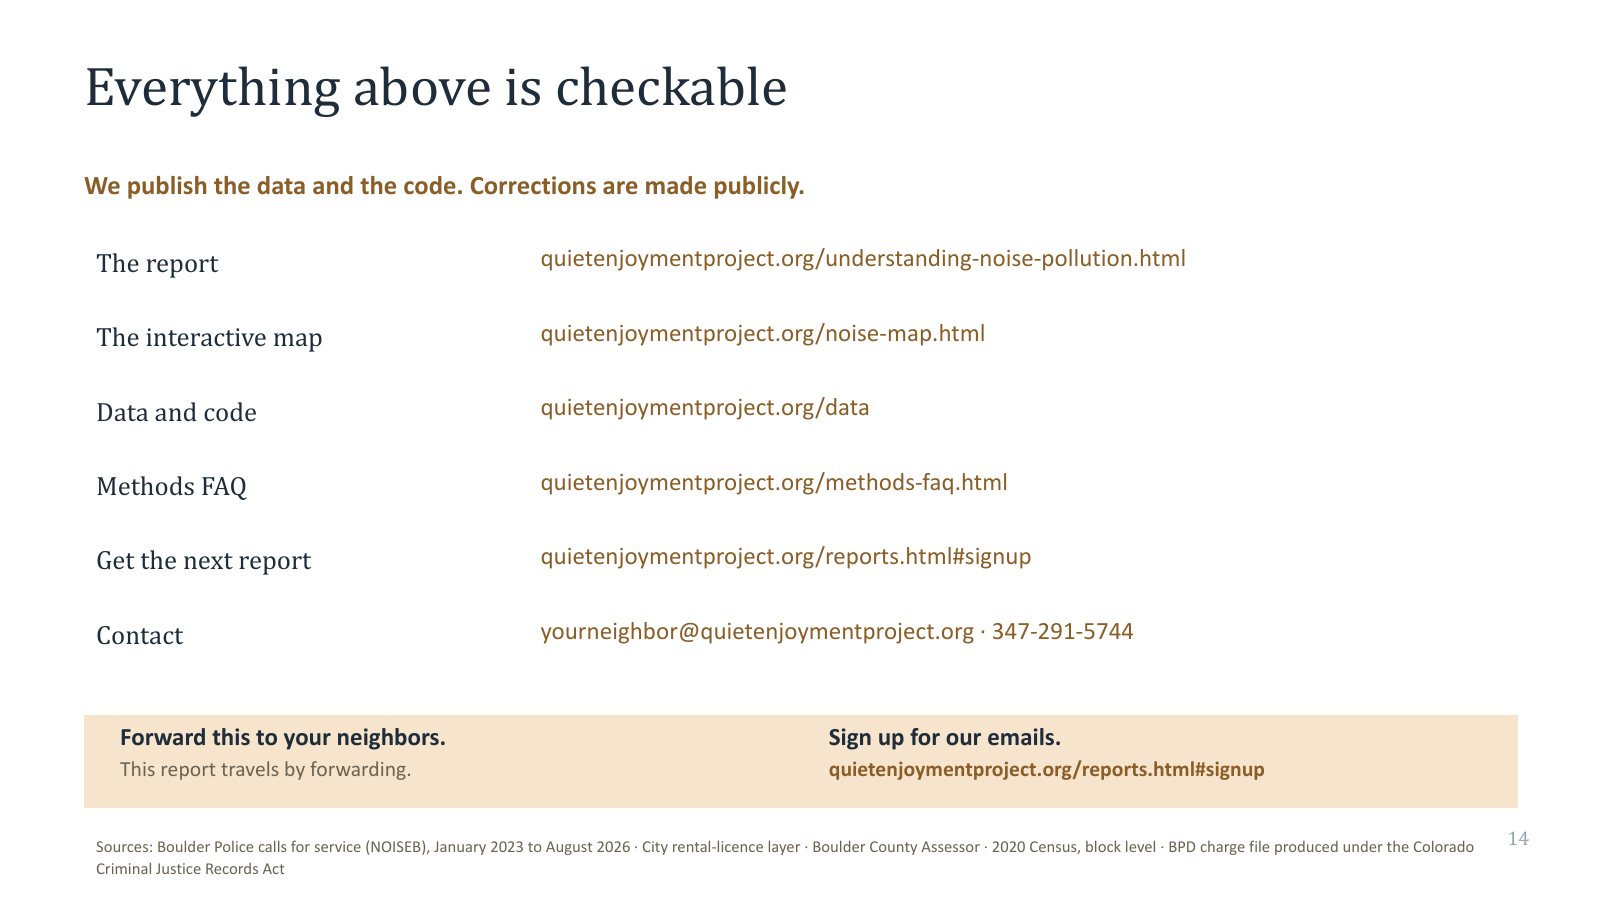
Title: Understanding Noise Pollution in Boulder - where it is, where it comes from, and who bears it. 70% of Boulder's noise complaints come from the CU walkshed. A heat map of complaints across Boulder, concentrated on University Hill. 6,297 of 9,011 complaints since January 2023. 26% of Boulder's people, 28,010 permanent residents including 3,957 children, absorb 70% of the noise, at 4.1 times the rate borne elsewhere. The noise pollution keeps CU's calendar. Two maps on an identical colour scale: school in session shows a dense plume over University Hill; winter break with students gone shows it almost gone. And the pollution is getting worse. Complaints in the walkshed by school year: 1,408, then 1,515 up 8 percent, then 1,777 up 17 percent. 2026 so far is running 29 percent above the same period last year. Noise pollution is a health problem, not an annoyance. The WHO night-noise dose bands with the state and Boulder legal limits marked, and a loud house party at the property line typically 70 to 90 decibels. Boulder's night starts last, and nobody measures the bass. State of Colorado: protected night begins 7 p.m., 45 dB if periodic, impulsive or shrill, 50 dB general. Fort Collins: 8 p.m., 50 dB residential. City of Boulder: 11 p.m., 50 dB, but 55 dB allowed until 11 p.m. All three measure in dB(A), which barely hears bass; none of them sets a limit for it. A barking dog is seven times more likely to draw a ticket than a house party in the university district. One ticket per 42 animal calls citywide against one per 320 noise complaints in the university district. It takes 122 complaints to produce one ticket, and 320 in the university district. South Boulder one per 46, University Hill one per 111, citywide one per 122, university district one per 320. Reaching Boulder's nuisance threshold takes 1,600 phone calls. A field of 1,600 dots, each one call to police, producing the five citations the threshold requires, against zero designations to date. It is a rental problem, and the City already holds the lever. Rentals inside the walkshed draw 0.26 complaints per licence a year against 0.07 elsewhere. Zero rental licences have ever been pulled and zero properties designated a chronic nuisance since September 2024. 21 hours a week covers half the problem. A heat map of complaints by day and hour, with Thursday, Friday and Saturday 8 p.m. to 3 a.m. outlined: 12.5 percent of the week, 52 percent of the complaints. The noise has a season, and the season is CU's. Complaints per night inside the walkshed: 1.0 during winter break, 3.3 in summer, 6.0 when school is in session, 10.2 during CU move-in. The rest of Boulder stays between 1.2 and 2.9 throughout. To be sure: the four objections we hear, and our answers. We request that City Council: direct staff to write to every rental owner, property manager and tenant in the CU walkshed about rental-licence exposure; send a warning letter to owner, manager and tenants whenever a property receives a warning; direct Boulder Police to enforce more aggressively and police all neighbourhoods equally; and lower the nuisance threshold from five tickets to two in any twelve-month period. And that Council fix the standard itself: adopt the state's night, with the residential limit starting at 7 p.m. as Colorado's does rather than 11 p.m.; tighten B.R.C. 5-9-6 so outdoor amplified sound in residential zones is a violation when audible beyond the property line rather than 100 or 200 feet past it, and add a C-weighted limit to B.R.C. 5-9-3, which measures only in dB(A); direct Code Enforcement to acquire noise meters and use them in the evening; and ask CU what it is doing with its problem students. Everything above is checkable. Links to the report, the interactive map, the data and code, the methods FAQ, and the sign-up for future reports. Appendix: the numbers behind slides 2 to 6. Appendix continued: the numbers behind slides 7 to 11, and the one excluded block.

This report travels by forwarding. Send it to a neighbour, your HOA list, or your neighbourhood’s Nextdoor. Get the next report as it publishes →